Playwright Trace Viewer is a GUI tool that lets you explore recorded Playwright traces of your tests meaning you can go back and forward though each action of your test and visually see what was happening during each action.
Recording a trace
Traces can be recorded using the BrowserContext.tracing() API as follows:
Browser browser = browserType.launch();
BrowserContext context = browser.newContext();

// Start tracing before creating / navigating a page.
context.tracing().start(new Tracing.StartOptions()
  .setScreenshots(true)
  .setSnapshots(true)
  .setSources(true));

Page page = context.newPage();
page.navigate("https://playwright.dev");

// Stop tracing and export it into a zip archive.
context.tracing().stop(new Tracing.StopOptions()
  .setPath(Paths.get("trace.zip")));
This will record the trace and place it into the file named trace.zip
Opening the trace
You can open the saved trace using Playwright CLI or in your browser on trace.playwright.dev.
mvn exec:java -e -Dexec.mainClass=com.microsoft.playwright.CLI -Dexec.args="show-trace trace.zip"Viewing the trace
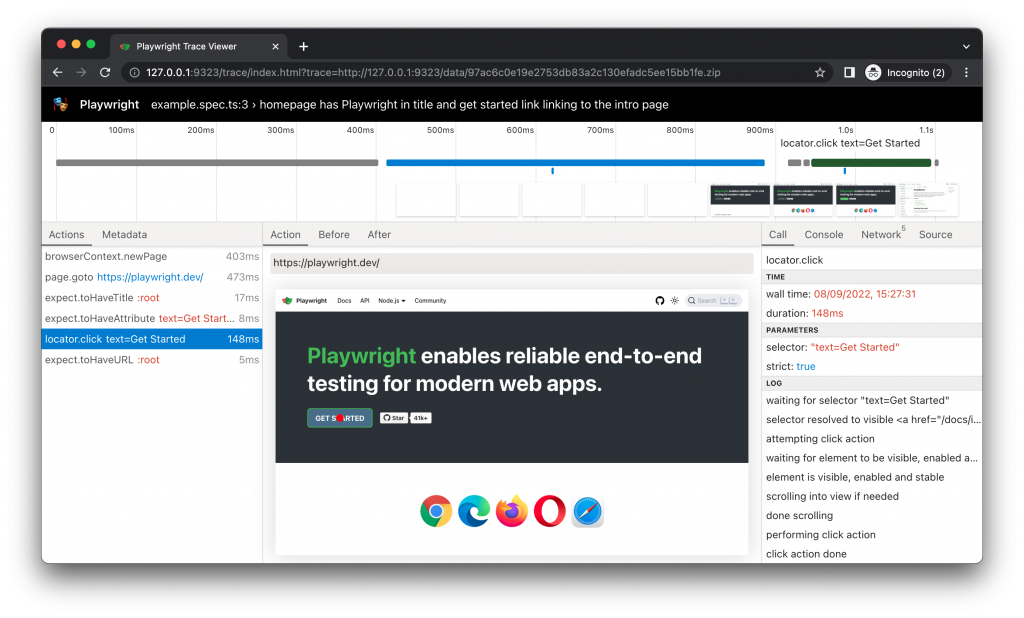
View traces of your test by clicking through each action or hovering using the timeline and see the state of the page before and after the action. Inspect the log, source and network during each step of the test. The trace viewer creates a DOM snapshot so you can fully interact with it, open devtools etc.